ViSSee / Visual Sensing
Skip the tour

Anatomy source: Janelia FlyEM Optic Lobe v1.1 · CC BY

A scroll-controlled story moves from an intact fruit fly into a rotated FlyEM optic-lobe rendering. After a clearly marked evidence boundary, the anatomy recedes and a separate computational model introduces temporal-frequency and spatial-frequency detectors without assigning them to biological locations.
  1. 01 / 08 · PERCEPTION

    Speed never arrives at the eye as a number.

    A compound eye receives changing light across space and time. Motion—and then speed—must be constructed from those changes.
  2. 02 / 08 · HEAD VOLUME

    Move through the surface, toward the visual system.

    As the exterior becomes transparent, the camera moves to the head and rotates into the optic-lobe volume.
  3. 03 / 08 · REAL ANATOMY

    Now the anatomy is data-derived.

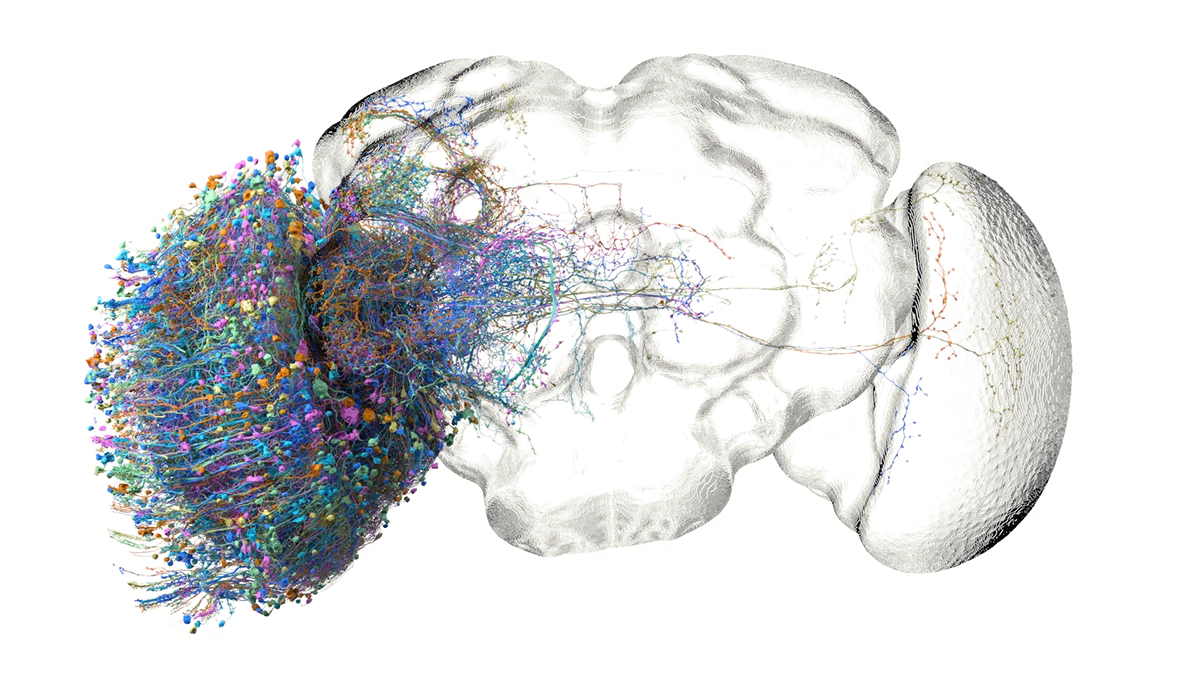
    This is a FlyEM rendering of the fruit-fly optic lobe—not an invented cutaway. The three-dimensional turn helps us read the volume without relocating any structure.
  4. 04 / 08 · VERIFIED PATHWAY

    Direction-selective signals converge on the lobula plate.

    The optic lobe contains lamina, medulla, lobula, and lobula plate. T4 and T5 are the first direction-selective neurons in the canonical ON and OFF motion pathways.
  5. 05 / 08 · EVIDENCE BOUNDARY

    The anatomical account stops here.

    Behaviour supports a speed computation, but it does not yet identify where its components sit. The visual world now changes deliberately from anatomy to model.
  6. 06 / 08 · MODEL CHANNEL 01

    Abstract temporal change.

    A TF detector represents temporal frequency: how quickly image intensity changes at a sampled location. It is a model component—not a labelled neuron or brain region.
  7. 07 / 08 · MODEL CHANNEL 02

    Abstract spatial structure.

    An SF detector represents spatial frequency: how tightly visual structure repeats across the image. The two channels now exist only on the computational side.
  8. 08 / 08 · SPEED HYPOTHESIS

    Test a speed estimate: V ∝ TF / SF.

    Behavioural experiments varied temporal and spatial frequency independently. Their ratio supplies a testable velocity hypothesis—without claiming an anatomical location for the calculation.
    Read the original research story

Visual sensing / Inside the fly

From real anatomy to an explicit model

The biological and computational views are intentionally separate. The first is sourced anatomy; the second is a non-spatial hypothesis.

01–02 / Organism

Zoom through the head surface.

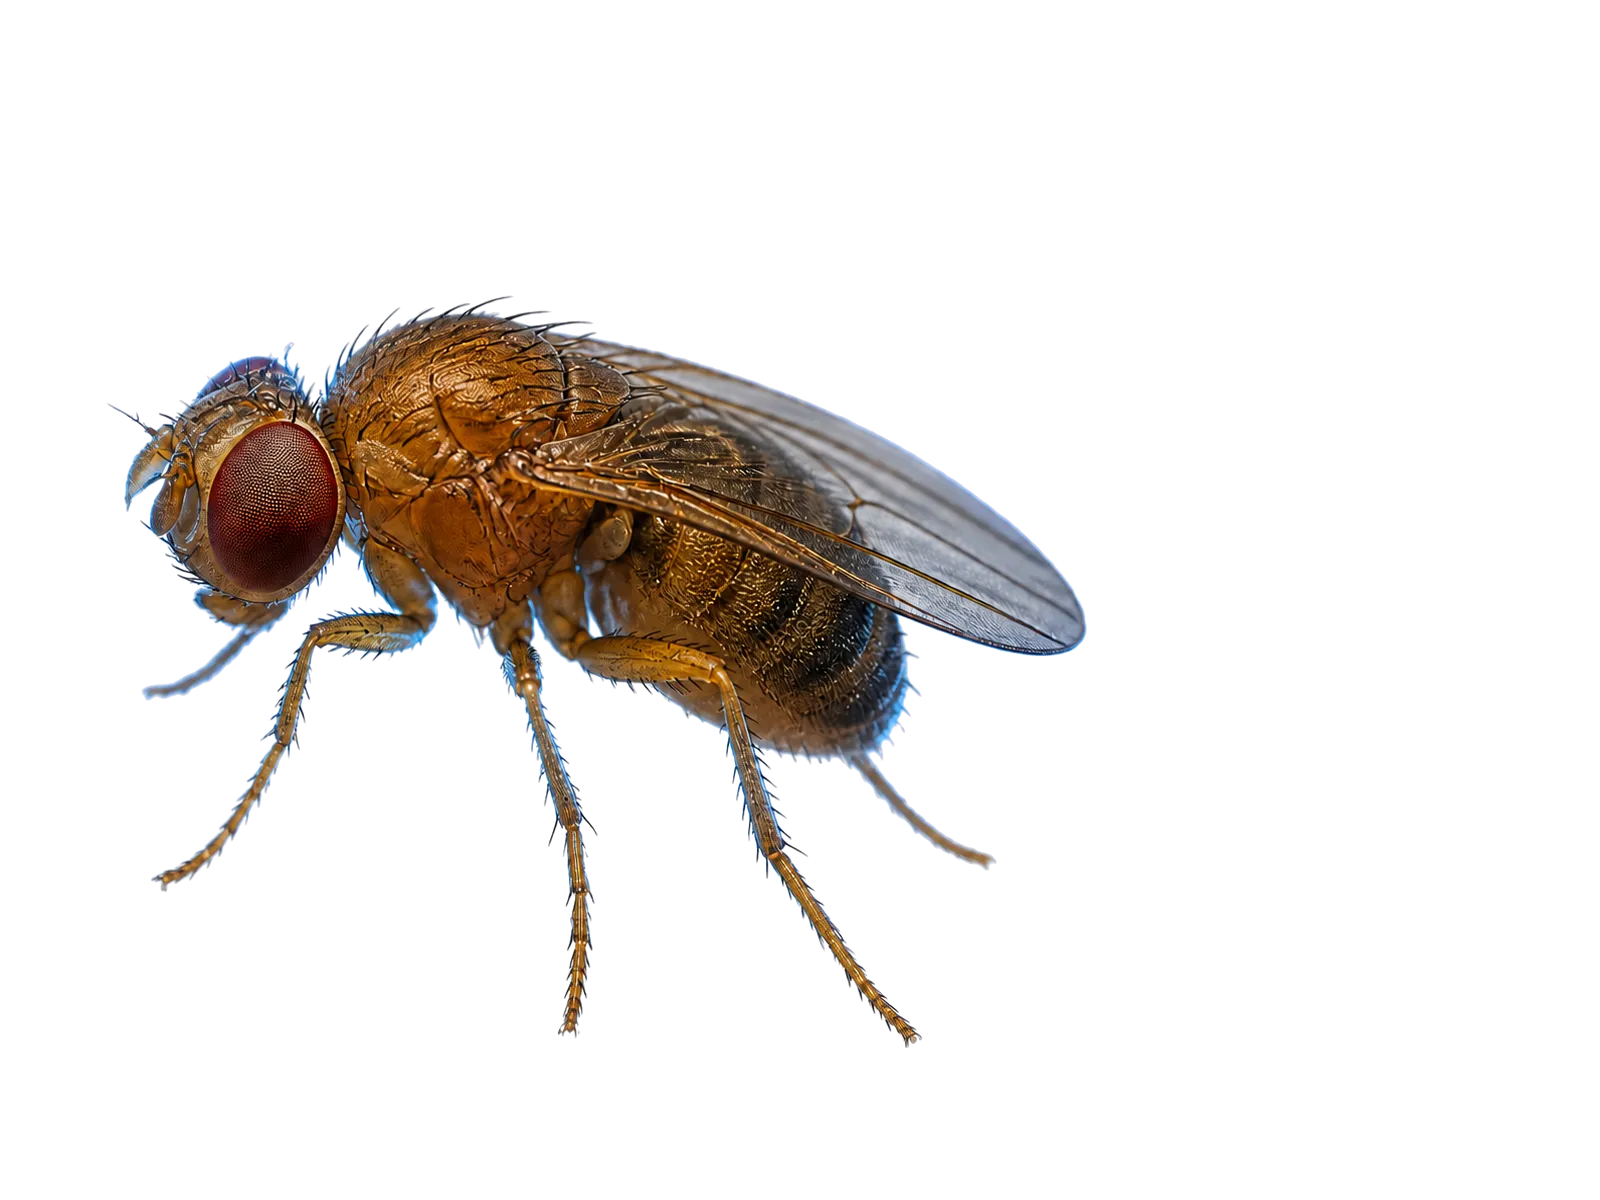
The intact fly establishes body, eye, and direction of travel before the camera turns inward.
An intact adult fruit fly seen from the side.

03–04 / Verified biology

The anatomical view comes from FlyEM.

Optic-lobe landmarks and canonical T4/T5 motion pathways are described without inventing a cutaway or placing unknown speed components.
A FlyEM rendering of the fruit-fly optic lobe and central brain.
Janelia FlyEM Optic Lobe v1.1 · Lamina · Medulla · Lobula · Lobula plate
Evidence boundaryBehavioural observations inform the model; they do not locate it in the brain.

06–08 / Computational model

TF and SF become abstract detector channels.

The candidate relationship V ∝ TF / SF is presented as a testable computation—not an anatomical map.
Read the original research story
An abstract computational diagram with temporal and spatial detector channels converging on a speed estimate.
TF detector · SF detector · V ∝ TF / SF · no inferred location